
Measures of Central Tendency in Statistics: Why it is important with examples


To know about the central tendency in statistics, we have to know what is Distribution in the first place.
What is Distribution?
Suppose you have a dataset or you've collected some data. Now, in that dataset, you have a group of scores on one or more variables.
Now if you take the scores of one variable and arrange them in order from lowest to highest, what you will get is called as a distribution of scores.
From this distribution of scores, we get to know about many things such as spreadness of the scores, highest and lowest scores, the most frequent scores, etc.
Central Tendency is such a useful characteristic of a distribution that Data Scientists and statisticians use it a lot.
Measures of Central Tendency:
Maybe you all know that Central Tendency consists of Mean, Median, and Mode. Central Tendency is used to describe a dataset by identifying the central position of that data. It is also called as Measures of Central Location.
Now, let's talk about all three measures of central tendency.
Mean
Mean(Average) is perhaps the most used and well-known measure of central tendency. Everyone knows how to calculate the mean of certain scores/values. Mean gives us a rough summary or idea about the distribution.
For example, if we have 5 values in a dataset like {1,2,3,4,5}, then the mean will be:
x̄ = (1+2+3+4+5)/5 = 3
Sample Mean is denoted by this x̄ (X bar) symbol.
Median
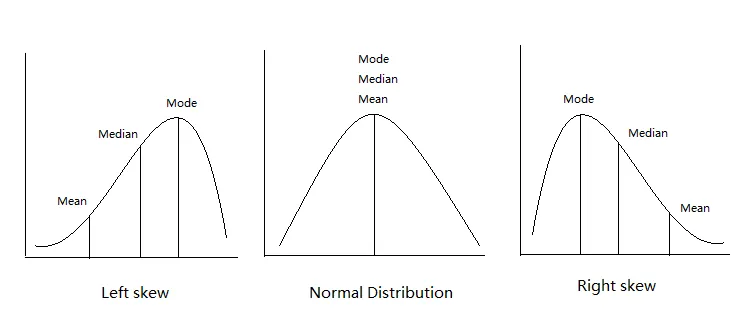
Median is the middle-most score of a distribution. We can also say that the median indicates the score that marks the 50th Percentile. It means 50% (percentage) of the scores in that distribution fall above the median and 50% fall below it.
A median is very useful when your dataset is skewed or has outliers.
For Example, let's take a sample distribution with an outlier: {1,2,3,4,5,100}
Now, mean = 115/6 = 19.16 which is far greater than the previous mean we calculated.
See, with the presence of one outlier, our mean has changed drastically.
In these scenarios, we calculate the median.
In the above example, the median will be (3+4)/2 = 3.5
Note, if we have an odd number of scores, then the middlemost value will be the median. And if we have an even number of scores, then we will calculate the average of the middle two scores.
Mode
Mode simply tells us which score in the distribution appears most often or has the highest frequency.
If the distribution has multiple modes, then it is called multimodal.
Where exactly Mean, Median, and Mode is useful?
Now, as you know about all three measurements of the central tendency, the question maybe appears in your mind when or where to use mean, median, or mode in a real dataset.
While doing Feature Engineering or Data Cleaning, you maybe see NaN (null) values in the dataset.
Now, if the dataset has continuous values/scores, the best practice is to replace those NaN values with the mean.
And, if there are outliers, then we can use the median for the replacement.
The mode can be used to replace NaN values in the case of categorical variables.